An investigation of the rheological properties of concentrated polystyrene suspensions.
ABSTRACT
Rheological properties of concentrated suspensions depend substantially on their structure; that is, on the formation of aggregates due to colloidal forces between particles. The aggregate size distribution is determined by the correlation between colloidal, Brownian and hydrodynamic forces in the system. Therefore, an investigation of the rheological properties of a suspension will provide valuable information on those forces. The aim of this project is to investigate the rheological properties of concentrated suspensions depending on an applied salt concentration and the comparison of the experimental results with the recently developed theoretical model.
Introduction
Significant approaches have been made to determine the effect of the thermodynamic interactions on the rheological properties of colloids. Particle size is one of the parameters for measuring the variance of fluid viscosity. Therefore, light-scattering techniques have played an important role in determining particle size distribution. Another issue is determining the interaction potential from either viscosity or elastic modulus and then using this to anticipate how the concentration, solvent quality or ionic strength influence the rheological functions.
3.1. Theory

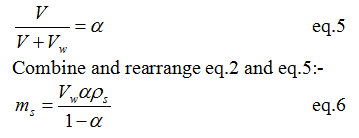
The relative viscosity is a function of volume fraction. However, the volume fraction can depend on the applied shear rate.
![Figure 1. Schematic 2D diagram of the equilibrium distribution of particles in dispersion of hard spheres. [Daniel Quemada, 2002]](https://www.ivoryresearch.com/wp-content/uploads/2013/04/michael-holding-fig-2.gif)
Figure 1. Schematic 2D diagram of the equilibrium distribution of particles in dispersion of hard spheres. [Daniel Quemada, 2002]
At a low volume fraction, the mean distance between particles is large compared to the particle radius. Thus, particles are able to move freely throughout the medium driven by Brownian forces. A volume fraction close to zero is considered to be the dilute limit. As volume fraction increases, hydrodynamic interactions as well as the probability of collision between particles become important.
At higher volume fraction, colloidal suspension presents a thermodynamic phase transition, the onset of which is the freezing concentration. In the very low shear stress, the distribution of particles is not significantly affected by the viscous forces.
4. Experiment
This section presents the preparation of the sample, the method used for analysing the sample and the experimental process.
4.1. Suspension
The suspension under investigation was bought from Microspore Technologies, UK. The suspension was refrigerated at a temperature of approximately 10°C after delivery.
4.2. Volume fraction determination
The determination of the volume fraction was not straightforward; the suspension was very diluted and a large amount of water needed to be removed even before a vacuum dryer could be used. (The vacuum dryer is only able to remove the residual water in the sample.) With every transfer from one container to another, tiny amounts of the suspension is lost. Eventually, the volume fraction obtained might be smaller than the original.
In this study, the determination of volume fraction was carried out according to the following procedure: 25ml of suspension was added to the centrifuge tube and was centrifuged at 12000 rpm for 30 min. After that, all the water above the solid suspension was removed and a vacuum dryer employed to achieve a dry suspension.

The results of those two samples are displayed in Table 1.
| Sample 1 | Sample 2 | |
| Volume fraction | 0.00233 | 0.05288 |
4.3. Experimental procedure
4.3.1. Particle size distribution
There were two major types of the samples that had been taken for the HORIBA measurement. These two samples could only be distinguished by their different volume fractions. In 0.3% and 5% volume fractions of the samples, various amounts of KCl solution, 0.01M, 0.1M, 0.3M, 1M and 3M, were added to the suspension and were stored at below 5oC overnight in order to gain coagulation.
The equipment used in the experiment is an analyser called HORIBA, which can obtain particle size distribution. It has been identified as one of the most popular light-scattering devices used for determining the particle size distribution of a material. In general, the scattering intensity detected by a detector placed at a distance much larger than the size of a particle is the result of the scattered electromagnetic radiation from different portions of the particle illuminated by a monochromatic light source. This scattering-intensity pattern is specific to a material with certain physical properties and particle size distribution.

Figure 2. Layout of HORIBA
4.3.2. Shear rate variation
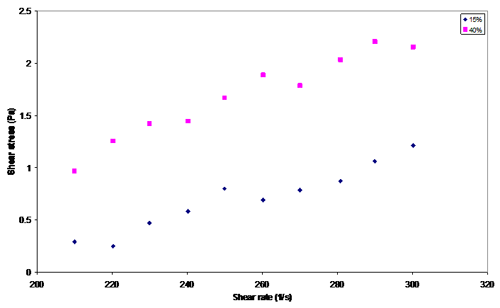
For this study, a dry suspension was used to create the designed volume fraction. Two different volume fractions were used: 15 vol. % and 40 vol. %. Furthermore, 25 ml of distillate water was added to a pure suspension and then ultrasound was employed to split the solid suspension. After the preparation of the sample, a rheometer was used to measure the viscosity and the shear stress of the sample at different shear rates.
The temperature of the suspension in the rheometer was maintained at a constant 20°C in all measurements.
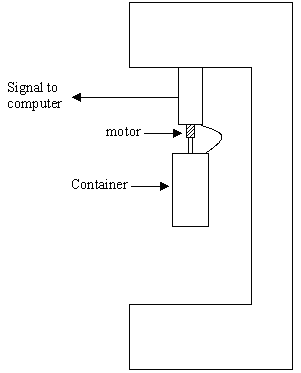
Figure 3. Layout of the rheometer
5. Results and discussion
5.1. Particle size distribution
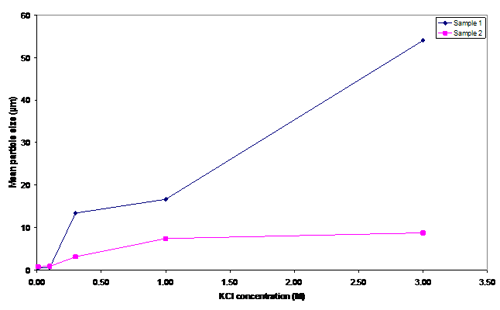
Figure 4. Mean particle size in several KCl concentrations
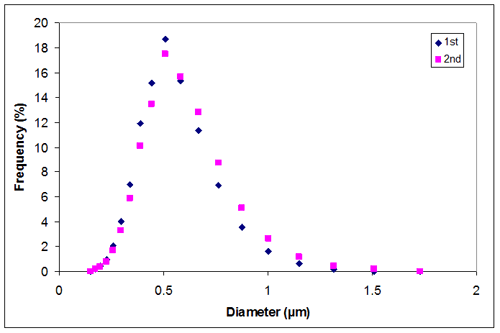
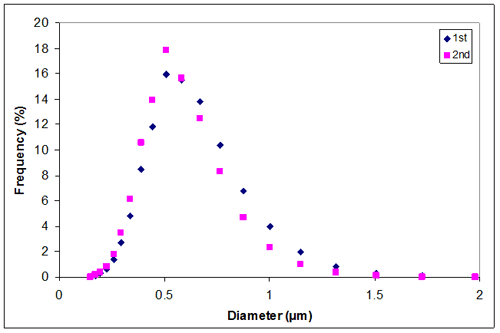
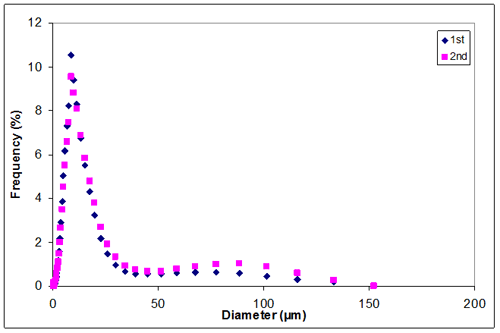
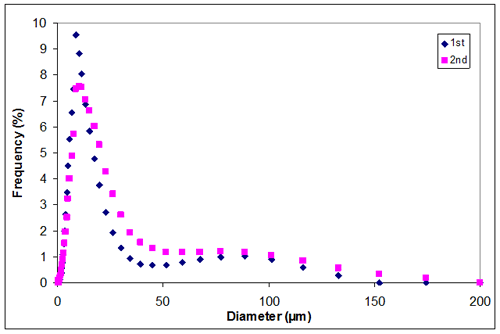
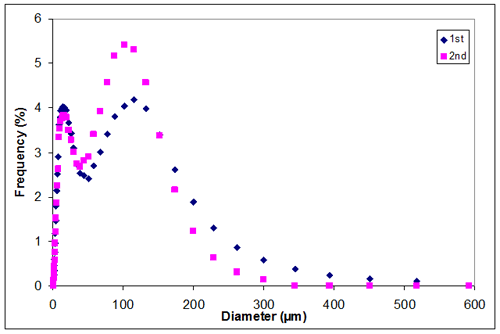
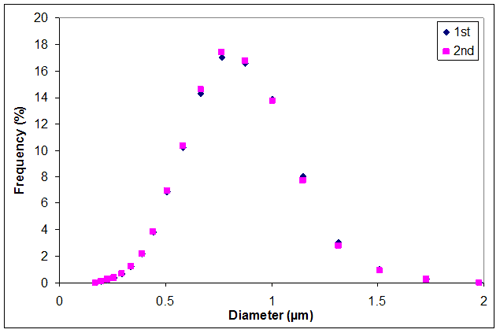
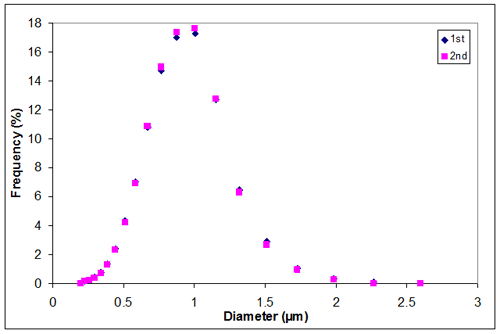
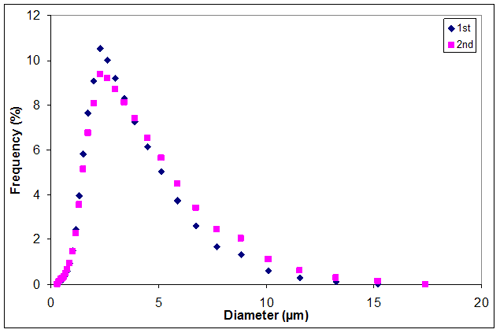
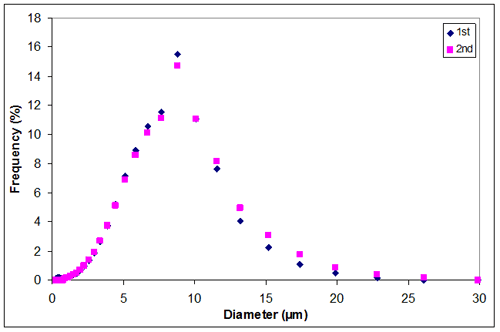
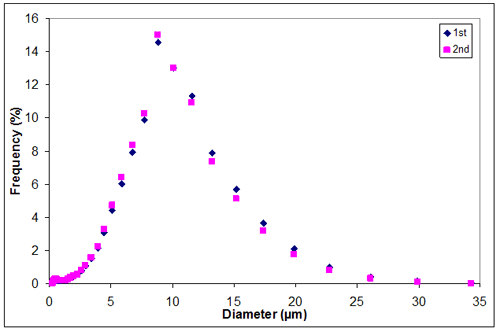
Initially, the particle sizes of samples 1 and 2 were approximately 0.5 µm and 0.7 µm, which agree with the Stokes-Einstein equation. For the KCl, concentrations are 0.01M and 0.1M. Added salt had no major influence on the particle sizes. However, when the salt concentration was 0.3M, the particle size for both samples increased significantly (13.38 µm and 3.07 µm), meaning that coagulation was achieved; consequently the van der Waals force becomes greater than the hydrodynamic force. To achieve the same particle size in suspensions with a different volume fraction, less salt is required in the 0.233 vol.% than the 5.288 vol.%. Because sample two had a greater number of particles, it required more salt to neutralise the surface charge of particles.
5.2. Shear rate variation
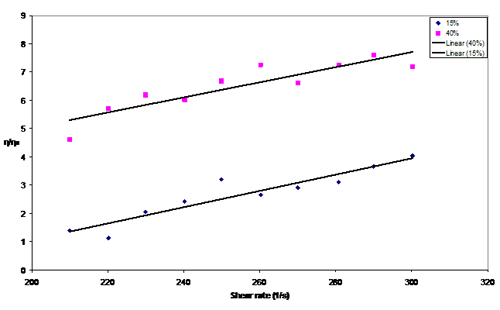
Figure 5. Relative viscosity measurement between 15 vol.% and 40 vol.%
The behaviour of the suspensions corresponds to the Bingham plastic fluids. The relative viscosity is larger for suspensions with higher concentrations (i.e. 40 vol.% > 15 vol. %).
6. Conclusion
More methods should be used to determine the volume fraction to define the range of error. For measuring the particles, the same salt concentration solution should be used as a solvent which will identify the suspension aggregate stability. The high fluctuation from the rheometer measurement suggests that more sophisticated equipment should be used in order to obtain more accurate results. Temperature has been assumed to be one of the properties that have no effect on the particle size. On the other hand, pH is the other unknown property which might affect the measurement. Further investigation needs to be considered.
7. References
E. V. Golikova, Yu. M. Chernoberezhskii, V. S. Grigor’ev, and M. P. Semov, Aggregate Stability of the Sol Prepared from Crystalline Quartz in Aqueous Solutions of Potassium Chloride, GLASS PHYSICS AND CHEMISTRY Vol. 32 No. 6 2006, pp 646-655
Daniel Quemada, Claudio Berli, Energy of interaction in colloids and its implications in rheological modelling, Advances in Colloid and Interface Science, Vol. 98, 2002. pp 51-85
V. Starova, V. Zhdanova, M. Meireles, C. Molle, Viscosity of concentrated suspensions: influence of cluster formation, Advances in Colloid and Interface Science, Vol 96, 2002, pp279-293
Anna Stradner, Helen Sedgwick, Fre´de´ ric Cardinaux,Wilson C. K. Poon, Stefan U. Egelhaaf & Peter Schurtenberger, Equilibrium cluster formation in concentrated protein solutions and colloids, Nature PublishingGroup, Vol 432, 2004, pp 492-495
8. Appendices
Appendix A. Mean Particle size of samples 1 and 2 in Table 1
Appendix B. Particle size distribution of sample 1 at 0.01M KCl
Appendix C. Particle size distribution of sample 1 at 0.10M KCl
Appendix D. Particle size distribution of sample 1 at 0.30M KCl
Appendix E. Particle size distribution of sample 1 at 1.00M KCl
Appendix F. Particle size distribution of sample 1 at 3.00M KCl
Appendix G. Particle size distribution of sample 2 at 0.01M KCl
Appendix H. Particle size distribution of sample 2 at 0.10M KCl
Appendix I. Particle size distribution of sample 2 at 0.30M KCl
Appendix J. Particle size distribution of sample 2 at 1.00M KCl
Appendix K. Particle size distribution of sample 2 at 3.00M KCl
Appendix L. Shear stress vs. shear rate for 15 vol. % and 40 vol. %
Sample 1 | |||
KCl conc. (M) | Mean particle size (µm) | ||
1st | 2nd | Average | |
0.01 | 0.4943 | 0.5257 | 0.51000 |
0.10 | 0.5605 | 0.5174 | 0.53895 |
0.30 | 12.2872 | 14.4732 | 13.38020 |
1.00 | 14.4732 | 18.7534 | 16.61330 |
3.00 | 55.5697 | 52.4698 | 54.01975 |
Sample 2 | |||
KCl conc. (M) | Mean particle size (µm) | ||
1st | 2nd | Average | |
0.01 | 0.7406 | 0.7366 | 0.73860 |
0.10 | 0.8351 | 0.8317 | 0.83340 |
0.30 | 2.9350 | 3.2050 | 3.07000 |
1.00 | 7.1849 | 7.5750 | 7.37995 |
3.00 | 8.8361 | 8.5831 | 8.70960 |
Appendix B
Appendix C
Appendix D
Appendix E
Appendix F
Appendix G
Appendix H
Appendix I
Appendix J
Appendix K
Appendix L