Marketing in the fragrance industry
Executive Summary
The global fragrance industry was worth $28.9 billion in 2008 and is forecasted to grow 3.20% by 2013. With Western Europe and the US market in the maturity stage it is essential to move to growth markets such as Asia, Africa and South America. The intense competition and rapidly changing consumer demands equates to companies needing to differentiate offerings, through brand development or celebrity endorsements.
Coty is one of the largest fragrance companies in the world with 63% of their revenue derived specifically from fragrances. Coty’s core competencies aid in developing their competitive advantages for a market which is in maturity and saturated. Coty has been able to follow their mission statement, and their priorities should focus on defending their current market share to fund new investments into growth markets.
In contrast to Coty, Scents of Time (SoT) is a SME which focuses on a specific niche market. SoT have fragrances based on historical scents and uses natural ingredients, which provides its unique selling point. In terms of brand positioning, the company should focus on high quality products using rare natural ingredients from which extra value derives from the informational supplements provided to educate the consumer on the fragrance. Along with positioning the company, SoT need to develop an internal marketing strategy to build stakeholders awareness of SoT and in particular aid employees in understanding the companies mission, value and strategic goals.
1. Introduction
The fragrance industry affects a variety of markets, which include cosmetics, household cleaning items, fabric care and air fresheners. The aim of this report is divided into four sections which include
- An assessment of the key factors that affect the fragrance sector and evaluate potential market opportunities.
- An analysis into Coty to evaluate their strategic priorities
- The strategic positioning planning for the Scents of Time brand to support a launch and future developments
- The development of an internal marketing strategy for Scents of Time to ensure that stakeholders are aware of the direction of the aforementioned strategic plan.
This report will be concluded with a summary of the key consideration from each section.
2. Key Factors Affecting The Fragrance Sector
This section will consist of an analysis into the environment that surrounds the fragrance sector.
2.1 Market Size and Growth
In 2008 the global fragrance market was worth $28.9 billion and is set to grow 3.20% by 2013 to $33.9 billion.
| Table 1: Global Fragrances Market Value Forecast: $ billion, 2008-2013 | |||
| Year | $ Billion | % Growth | |
| 2008 | 28.9 | 3.00% | |
| 2009 | 29.8 | 2.90% | |
| 2010 | 30.7 | 3.10% | |
| 2011 | 31.7 | 3.20% | |
| 2012 | 32.7 | 3.30% | |
| 2013 | 33.9 | 3.50% | |
| CAGR (2008- 2013) | 3.20% | ||
| Source: Datamonitor (2009h) | |||
Europe is the most attractive market as it has the highest value (see table 2). However, the Americas also represents the same opportunity.
| Table 2: Global Fragrance Market Segmentation: % Share, by Value 2008 | ||||
| Geography | % Share | |||
| Europe | 51.70% | |||
| Americas | 40.00% | |||
| Asia-Pacific | 8.30% | |||
| Total | 100% | |||
| Source: Datamonitor (2009h) | ||||
The European market in 2008 was worth $15 billion and is forecasted to grow by 2.4% to $16.8 billion (Datamonitor, 2009e). France is the key market in Europe as it has the highest value, however Germany also represents the same potential.
| Table 3: European Fragrance Market Segmentation: % Share, by Value 2008 | ||||
| Geography | % Share | |||
| Rest Of Europe | 44.20% | |||
| France | 19.00% | |||
| Germany | 16.20% | |||
| UK | 11.50% | |||
| Italy | 9.20% | |||
| Total | 100% | |||
| Source: Datamonitor (2009h) | ||||
The US was worth $5.5 billion in 2008 and is set to decline by 2.6% to $4.8 billion by 2013 (Datamonitor, 2009p); this may be a reflection of the economic crisis. However, the other countries in the Americas show growth, in particular Brazil.
| Table 4: Americas (excluding the US) Fragrance Market Value Growth: $ billion, Between 2008 and 2013 | ||||
| Geography | 2008 | 2013 | Growth | |
| Brazil | 4.10 | 6.90 | 11.00% | |
| Canada | 0.70 | 0.79 | 2.70% | |
| Mexico | 0.62 | 0.68 | 1.70% | |
| Source: Datamonitor (2009b,2009c and 2009l) | ||||
In 2008, the Asia-Pacific market was worth $2.4 billion and is forecasted to grow at a faster rate than Europe and the US (Datamonitor, 2009). Japan has the largest value but is forecasted to have negative growth. In contrast China and India show high growth rates although being worth less (see table 5).
| Table 5: Asia-Pacific Fragrance Market Value Growth: $ billion, Between 2008 and 2013 | ||||
| Geography | 2008 | 2013 | Growth | |
| Australia | 0.43 | 0.54 | 4.80% | |
| China | 0.51 | 0.79 | 9.20% | |
| India | 0.03 | 0.04 | 7.10% | |
| Japan | 0.80 | 0.73 | -2.00% | |
| Source: Datamonitor (2009a, 2009d, 2009i and 2009k) | ||||
A final consideration is Africa and the major country to examine is South Africa. In 2008 the South African fragrance industry was worth $412.5 million and is forecasted to grow by 4.9% to $525.2 million by 2013 (Datamonitor, 2009). South Africa is set to grow faster than both the US and Europe although being worth less.
2.2 Life Cycle Analysis
Figure 1 indicates that Brazil is a rising star with high market growth and a high market value. China and India represents question marks and present an opportunity due to a high rate of growth.
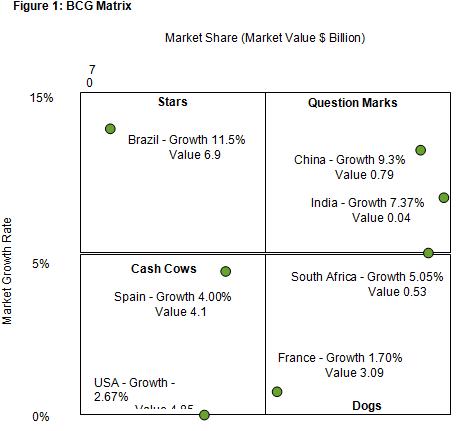
Data taken from Appendix 1 and 2
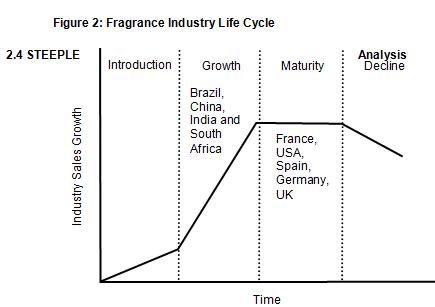
France is shown as a Dog but only by a fraction. As France is a prominent market (see table 3) divesting out of this country is not advisable. The high value and slow rate of growth equates to a defensive strategy to protect market share. The US represents one of the largest markets, however, it is forecasted for negative growth. With this in mind, the slow growth rate and high values of the cash cows (considered to be in maturity), can be used to support the growing markets such as Brazil, China, India and South Africa (Figure 2).
The key STEEPLE considerations are seen in Figure 3.
| STEEPLE | Factor | Issue | Possible Resolutions |
| Social | Celebrity Culture | Celebrity endorsed products are becoming more popular, one in five young adults in the UK use a fragrance endorsed by a celebrity (Keynote, 2008). | Encourage the use of celebrity endorsements for marketing products |
| Organic Cosmetics | Consumers are focusing on natural ingredients in fragrances | Source natural organic ingredients to use with products and use this as a selling point | |
| Ageing Population | The population in Europe is ageing (Keynote, 2008) and this may result in the need for more anti-ageing cosmetics. This segment also usually has more disposable income and therefore can afford premium-priced products. | Move into anti-ageing product markets where the segments have the potential to have a higher spend on cosmetic products. | |
| Self Image | As the population becomes increasingly focused on personal appearance and self image the use of fragrances and cosmetics will increase. | Market the potential effects of products to effect self image i.e. anti-wrinkle cosmetics/ |
2.5 Porter’s Five Forces
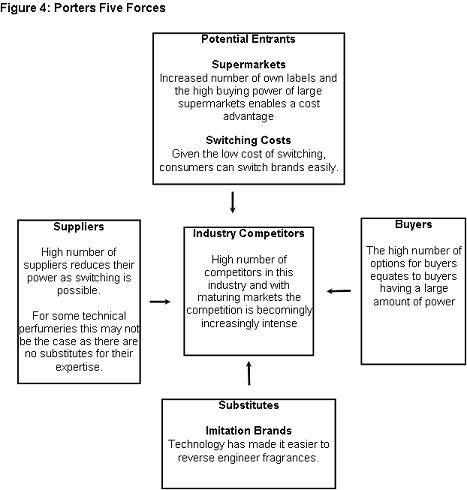
The key issues are the ability for consumers to switch brands easily and the intensive competitive environment. In addition the potential for supermarkets to enter the industry with own labels further increases competition (see figure 4). However, it has been indicated that quality plays a large part, particularly in luxury goods.
2.6 Competitor Analysis
Table 6 shows that L’Oreal has a large presence in the fragrance industry in Europe, the US and globally, and Coty has the largest variety of brands and has the highest global value. Each region also has a number of smaller companies that were listed as ‘others’. This indicates that there is a potential for smaller companies.
| Table 6: Key Competitors in The Fragrance Industry By Region (2008) | |||
| Market | Key Fragrance | ||
| Company | Share | Brands | Countries |
| Asia – Pacific | |||
| Chanel | 10.20% | 16 | Europe, Asia and the US |
| Shiseido Company Ltd | 8.80% | N/A | Europe, Asia and Americas |
| LMVH Moet Hennessey | |||
| Louis Vitton SA | 7.70% | 8 | Europe, Asia, Americas and Middle East |
| Europe | |||
| Procter and Gamble | 8.40% | 11 | Europe, Asia, Americas, Middle East and Africa |
| Puig Beauty and Fashion | 8.20% | 24 | Europe, Asia, Americas and Africa |
| L’Oreal | 7.90% | 9 | Europe, Asia, Americas, Middle East and Africa |
| US | |||
| Coty Inc | 21.20% | 42 | US, Asia-Pacific and Europe |
| The Estee Lauder | |||
| Company Inc | 20.00% | 10 | Europe, Asia, Americas, Middle East and Africa |
| L’Oreal S.A. | 10.10% | 9 | Europe, Asia, Americas, Middle East and Africa |
| Global | |||
| Coty Inc | 9.90% | 42 | US, Asia-Pacific and Europe |
| L’Oreal S.A. | 7.20% | 9 | Europe, Asia, Americas, Middle East and Africa |
| Puig Beauty and Fashion | 5.50% | 24 | Europe, Asia, Americas and Africa |
| Source: Datamonitor (2009, 2009e, 2009p and 2009h) | |||
As well as examining regions, the key countries forecasted for growth (in section 2.2) will also be examined. Table 7 shows that Brazil is dominated by local companies and the presence of the larger global brands are not as apparent.
| Table 7: Key Competitors From The Fragrance Industry For Key Countries (2008) | |||
| Market | Key Fragrance | ||
| Company | Share | Brands | Countries |
| Brazil | |||
| Natura Cosmeticos SA | 21.30% | 6 | South America and France |
| Boticaro S.A | 19.30% | 26 | Brazil, Portugal, Mexico, Bolivia, Peru, Paraguay |
| Avon Products, Inc. | 15.10% | 13 | Americas, Europe, Middle East, Africa and Asia |
| China | |||
| Shanghai Jahwa | |||
| United Co, Ltd | 26.70% | 6 | Asia |
| LMVH Moet Hennessey | |||
| Louis Vitton SA | 9.10% | 8 | Europe, Asia, Americas and Middle East |
| Coty Inc | 8.50% | 42 | US, Asia-Pacific and Europe |
| France | |||
| LMVH Moet Hennessey | |||
| Louis Vitton SA | 12.60% | 8 | Europe, Asia, Americas and Middle East |
| Chanel | 8.30% | 16 | Europe, Asia and the US |
| Procter and Gamble | 8.20% | 11 | Europe, Asia, Americas, Middle East and Africa |
| Source: Datamonitor (2009b,2009d and 2009f) | |||
2.7 Customer Analysis
There are several market segments in the fragrance industry (shown in table 8). This indicates two fundamental characteristics of consumers:
- The high-end market customers who are willing to pay more for the quality ingredients used in the fragrance.
- The low practical end customers who use the fragrance product as a necessity rather than a luxury.
| Table 8: Potential Market Segments | |
| Segment | Characteristics |
| Older Population |
|
| Working Women |
|
| Younger Market |
|
| High Quality |
|
| Natural Ingredients |
|
| Sporty |
|
2.8 Potential Market Opportunities
Table 9 highlights the key factors to consider when evaluating market opportunities.
| Table 9: SWOT Analysis Weakness | |
| Strength | Weakness |
| – The profit margins in the fragrance industry are generally high |
|
| Opportunities | Threats |
|
|
The information in previous sections can contribute to establishing key success factors (KSF) for the fragrance industry, see table 10.
| Table 10: Key Success Factors For The Fragrance Industry | ||
| What Customers Want | How Do Firms Survive | KSF |
|
|
|
Through analysing the key factors that will affect the fragrance sector, two overall market opportunities have been established
- Attack the Asian, African and South American market, which represent the growth markets. With the Asian economy growing, consumers have more disposable income and therefore can spend more on luxuries, which presents the opportunity of launching prestige product lines in countries such as China.
- Although these markets have a lower value, the rate of growth indicates that they may become just as valuable in the long run.
- When considering entry into new foreign markets it is essential to consider the cultural differences. Consumers will have different tastes and possibly use the product in an unintended way. Research is required to gain insights into these differences.
- An alternative to research, which is a time consuming process, are acquisitions and mergers. Both options require substantial capital to implement.
- Defend the European and US markets, which are in maturity and have a high value, but come with a large number of competitors and established brands.
- With intense competition in Europe and the US a defensive strategy is better suited and product differentiation is more important. Unique scents and attracting niche markets will be better suited i.e. using natural ingredients from exotic destinations.
- Adjusting the packaging of the fragrances is a source of differentiation as unique bottle shapes can be limited edition versions and add more value.
- The use of celebrity endorsements can be a source of differentiation in a highly competitive market.
3. Coty’s Strategic Position Priorities
3.1 Coty And Their Mission Statement
As established in section two, Coty is a key competitor in the fragrance industry. In 2008 Coty Inc had a 9.90% share of the global value of the fragrance industry (Datamonitor, 2009). It was established in 2005 that 63% of Coty’s revenue was derived from fragrances and in 2008 Coty’s fragrance portfolio included 42 brands. Coty’s mission statement consists of four elements, which will be assessed.
3.1.1 Deliver Extraordinary Fragrance and Beauty Products
Coty has a wide range of products including a high quality prestigious product line. The brands in the prestige product portfolio all denote high quality. Coty’s intention to deliver high quality fragrance was further enforced by the acquisition of Unilever’s premium fragrance portfolio. Coty has focused on developing celebrity-endorsed products, however this is a volatile strategy as celebrity perception can change very rapidly i.e. the events involving Tiger Woods. With this in mind, certain celebrities can also detract from a brand and therefore contradict the overall aim for high quality.
3.1.2 Honesty, integrity, empowerment and openness
As a principal this aspect encourages and motivates employees. By encouraging openness and empowerment, employees are able to provide feedback and work in a creative manner. The key aspect is that it encourages internal communications.
3.1.3 Breakthrough excellence in creation, design and experience
The CEO’s vision for products to go faster to market and to think more freely falls in line with this element of the mission statement. A key competency for Coty is their creativity and the ability to develop and introduce new fragrances, but also to focus on designing innovative packaging, as seen with the collaboration with a French designer.
3.1.4 Stay close to our consumers and communities
The development of an online shop reduces the barriers between Coty and the consumer. This is further developed by launching the fragrance bays. This allows Coty sales representatives to provide a personal service to consumers but also acts as a method of encouraging consumer interactions. This allows Coty to gain a deeper understanding of their consumers.
3.1.5 Coty’s ability to meets its mission
Coty have demonstrated that they follow their mission statement and in particular their ability to deliver extraordinary fragrances with the focus on the prestige line and to deliver breakthrough excellence with their rapid cycles of creation when launching new fragrances.
3.2 Coty’s strategic priorities
Coty’s resources and core competencies indicates where their competitive advantages lie. Coty should base its strategies on the environment and its competencies to gain a strategic fit.
3.2.1 Coty’s resources and core competencies
Coty’s resources are assessed in table 11, through the VRIO framework.
| Table 11: VRIO for Coty | |||||
| Competency/Resource | Valuable | Rare | Costly To Imitate | Does The organisation have the ability to exploit | Competitive Implication |
| Large number of established brands | Yes | No | Yes | Yes | Ability to target different markets with different brands |
| Quick R’n’D to introduction for new products | Yes | Yes | Yes | Yes | Fast R ‘n’D allows Coty to gain a competitive advantage by launching products more frequently |
| High number of celebrity endorsements | Yes | No | No | Yes | With consumers falling to a celebrity culture, this provides a source of differentiation in a highly competitive market. |
| High amount of capital available | Yes | No | No | Yes | This allows Coty to develop and research products quicker but also presents the opportunity to acquire or buy licenses when entering new countries |
3.2.2 Strategic fit
From the analysis of the environment in section two of this report a match between what Coty is able to do (i.e. available resources and competencies) and what the environment has indicated is possible.
| Table 12: Strategic Fit For Coty | |||
| Environment | Affect | Resource/Competency | Resolution |
| Western Europe and the US are in Maturity | Highly competitive environment with a strong need for differentiation | Fast R ‘n’ D capabilities | Allows Coty to develop new products to remain competitive amongst intense competition. |
| Celebrity endorsements | Increasing the number of celebrity endorsements provides a USP for Coty and will differentiate its offerings. | ||
| Asian, African and South American Markets in Growth Stage | Presents an opportunity to be exploited, with Coty’s existing markets in maturity new sources of revenue need to be found. | High amount of capital | Capital can be used to undertake research into the cultural difference and tastes. |
| Existing companies can be acquired to enter new markets, as their knowledge will reduce the amount of research required. | |||
| Further capital to invest into growth markets can be harvested from Coty’s mature markets. | |||
| Fast R ‘n’ D capabilities | Coty can transform research into products rapidly and therefore enter the market at a quicker rate | ||
| Celebrity endorsements | Global celebrities can be used to break down cultural barriers e.g. David Beckham | ||
| Quality products are becoming more essential | Highly competitive markets can be differentiated through quality. With fragrance being considered a luxury item quality products are expected. | Fast R ‘n’ D capabilities | Researching new scents and turning them into products quickly provides a competitive advantage. |
| Large number of established brands | Coty’s prestige product line provides the perception of high quality, and with this becoming increasingly important focusing on the market development of these brands will aid in maintaing market share. | ||
3.2.3 Adapted Shell Matrix
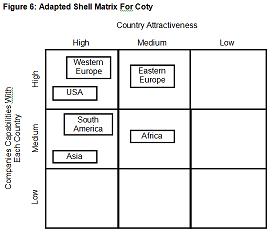
There are several regions that are worth investment (see figure 6). The South American and Asian market are the most attractive, however Coty may not be as capable of exploiting these markets.
3.2.4 Strategic Priorities
Coty’s priorities should be considered as follows
- The main priority is market penetration of the current market through brand development and market developments of premium fragrances. Coty should focus on defending what they have before focusing heavily on new markets. Revenues from mature markets can be used to fund investments required to enter a new market.
- Developing Coty’s existing brand will aid in maintaining their competitive position. This can be done through increasing celebrity-endorsed products, as these add an exclusive differentiating factor.
- Emphasis on the prestige line is required by consumers as quality has been deemed a critical factor for future sales. This will coincide with using rare and natural ingredients in fragrances.
- Develop a marketing information system. Although not currently considered by Coty, the need to understand their consumers is increasingly important in a highly competitive market. This is will allow for the correct development of brands and identifying the correct market to target the prestige line to.
- Coty should aim to successfully move into new growth markets such as Asia and South America as new sources of revenue will be required. This can be done through market development and taking existing products to a new market. This is a key strategy but it is vital that Coty maintain their current share in their existing markets.
- Coty have also indicated that there are plans develop their colour cosmetic products, however this product contributes less to their revenue.
4. Scents of Time brand positioning
Scents of Time (SoT) produces perfumes based on scents ‘lost in time’. The intention is to launch fifteen fragrances designed to recreate old scents for modern use.
4.1 Scents of Time Positioning
To assess the positioning of SoT the brand will be assessed over five criteria, shown in table 13.
| Table 13: Brand Positioning | |
| Brand | |
| Brand Name | Scent of Time |
| Product Attributes |
|
| Potential Market |
|
| USP |
|
| Usage |
|
| Values |
|
| Personality |
|
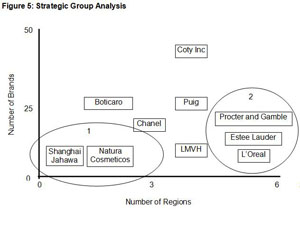
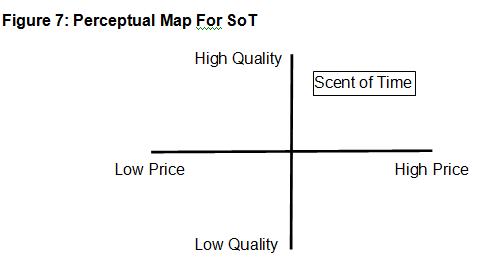
From table 8 (section 2.7) potential segments in the fragrance industry are outlined. SoT should target the high end, older consumer and natural ingredient segments. In addition to this a new segment of novelty or bottles for perfume collectors can also be targeted. SoT should be positioned as a high end niche product targeted (see figure 6) at specific consumers and therefore should adopt a differentiation focus. The strategy should be to focus on the research of new rare scents to develop new products, as this is SoT key competitive advantage. Despite the high costs to research new scents, consumers are willing to pay more for niche products and therefore the costs can be offset.
4.2 Product Launch
When considering the product launch an appropriate marketing mix is required (shown in table 14) for both B2C and B2B markets. The main goal for the product launch is to build awareness and communicate the brands intention to both consumers and retailers, which should be congruent with the brand positioning.
| Table 14: Marketing Mix for Scents of Time | |
| Marketing Mix | Resolution |
| Price | B2C
B2B
|
| Product | B2C and B2B
|
| Place | B2C
B2B
|
| Promotion | B2C
B2B
|
| People | B2C and B2B
|
| Physical Evidence | B2C and B2B
|
| Processes | B2C and B2B
|
4.3 Scents of Time Future Development
The SWOT analysis (see table 15) presents the key opportunities for SoT future development. The USP and an experienced owner provides SoT with their source of competitive advantage, and whether they are sustainable is to be addressed. A SoT product presents a constraint as the products are pushed to market and not based on consumer needs. It will benefit SoT to develop scents that addresses consumer needs but that also relates to history. To develop relationships with consumers, feedback can be left on the website where consumers can suggest scents from previous holidays. Another link to build is with horticultural societies as they can provide information on extinct and rare flowers and plants which can be a source of information for NPD.
| Table 15: SWOT Analysis For Scents of Time | |
| Strengths | Weakness |
|
|
| Opportunities | Threats |
|
|
SoT’s USP and a focus on a niche is the best approach as the mainstream market is saturated with competitors and the unique nature and relatively small size of this market is unlikely to attract major players. With certain scents being specific to other countries it presents the opportunity to export certain fragrances to foreign markets, for example the ‘Cleopatra’ and ‘Tutankamen’ fragrance may sell well in the Middle East.
5. Scent of Time internal Marketing Strategy
To aid in achieving SoT brand positioning strategy, a successful launch and ensure the longevity of the company, an internal marketing strategy to increase communications is required. An essential element of this is to assess the key stakeholders of SoT so a strategy can be devised to communicate with them.
5.1 Identification of key stakeholders
Key stakeholders have been assessed in table 16.
| Table 16: Key Stakeholder Analysis For Scents of Time | |
| Stakeholder | Impact |
| Investors |
|
| Suppliers |
|
| Creditors |
|
| Customers |
|
| Employees |
|
| Managers |
|
| Competitors |
|
| Professional Associations |
|
5.2 Objectives
The objectives for SoT’s internal marketing are as follows:
- To increase the awareness of key stakeholders of SoT missions and values by 60% within five years.
- Increase the awareness of key stakeholders of the future direction of SoT by 40% in two years.
- Encourage feedback from employees by 50% within five years.
5.3 Strategy and Implementation
To devise an appropriate strategy the internal market will be divided into two segments (see table 17). This allows for a targeted strategy for the segments.
| Table 17: Stakeholder Segmentation For Scents of Time | |
| Internal Stakeholders | External Stakeholders |
| Managers | Suppliers |
| Employees | Creditors |
| Investors | Customers |
| Competitors | |
| Professional Associations | |
A marketing mix will be developed for each segment to effectively provide relevant information to achieve the objectives (see table 18).
| Table 18: Internal Marketing Mix for Scents of Time | |||
| Internal Stakeholders | External Stakeholders | ||
| Marketing Mix | Factors | Marketing Mix | Factors |
| Product |
| Product |
|
| Price | N/A | Price | N/A |
| Promotion |
| Promotion |
|
| Place |
| Place |
|
For internal stakeholders a personal and more direct approach is suitable as it increases trust and the ability to retain the message. This approach also encourages two-way communication between management and employees and therefore encourages feedback. External stakeholders will require information to be made available, but not as direct as they may not be directly involved with the company. The key channel for information will be through the Internet as it is the most effective. PR activities and corporate events are good approaches given that SoT is fairly new and has a good USP that should grab the attention of the media. However, they are not as cost effective.
5.4 Evaluation
To gauge the success of this strategy initial research needs to be undertaken as a current measure. This will include:
- What do stakeholders currently know about SoT’s missions and values?
- What do stakeholders currently know about SoT’s long term direction?
- What percentage of employees currently leave feedback?
A longitudinal study will demonstrate whether the strategy has worked and the desired actions and awareness levels have been achieved. From the evaluation it is essential to consider what has been learned i.e. what are the most effective means of communication with stakeholders? It also provides the opportunity to identify any resistance to change and the cause, for example, in the future a scent related to mayans maybe found but employees may not approve of the sacrificial traditions.
6. Conclusion
In conclusion, there are a variety of factors that will affect the fragrance industry and these present a variety of market opportunities. The growth in the Asian, African and South American markets presents a new source of revenue as Western Europe and the US are in maturity and have saturated markets with an intense competitive environment. The key factors for success in the fragrance industry involve developing premium lines, increasing celebrity endorsements and moving into growth markets.
Coty is one of the largest global fragrance companies with key competencies, which provide a competitive advantage. Coty’s ability to create and launch products rapidly, combined with a range of prestigious and celebrity endorsed brands allows the company to remain competitive. Coty’s key strategic priority is to defend their current position, which will create capital to aid in investments in growth markets. Another priority is to develop a marketing information system to develop information on consumers.
Scents of Time provide unique products that focus on recreating old scents based on history and bringing them to the modern world. Their products are targeted at niche markets and the brand is positioned as a high quality and high priced product. The strategy to target a niche market is beneficial as the mainstream fragrances market has intense competition. A smaller niche market may not attract major competition as the segment may not be considered as substantive. In line with developing a new brand position, it is essential to communicate these changes to stakeholders. Building awareness of company missions and goals as well as the strategic direction of the company will reduce resistance to change as well as tailor the organisation to achieve a common recognised goal.
7. References
BBC (2009). ” G20: Economic Summit Snapshot”. Available at: http://news.bbc.co.uk/1/hi/in_depth/business
/2009/g20/7897719.stm#china[Date Accessed: 8th March 2010]
Coty (2010). “Brands”. Available at: http://www.coty.com/ [Date Accessed: 8th March 2010]
Datamonitor (2009) Fragrances in Asia Pacific: Industry Profile. October 2009. London: Datamonitor.
Datamonitor (2009a) Fragrances in Australia: Industry Profile. October 2009. London: Datamonitor.
Datamonitor (2009b) Fragrances in Brazil: Industry Profile. October 2009. London: Datamonitor.
Datamonitor (2009c) Fragrances in Canada: Industry Profile. October 2009. London: Datamonitor.
Datamonitor (2009d) Fragrances in China: Industry Profile. October 2009. London: Datamonitor.
Datamonitor (2009e) Fragrances in Europe: Industry Profile. October 2009. London: Datamonitor.
Datamonitor (2009f) Fragrances in France: Industry Profile. October 2009. London: Datamonitor.
Datamonitor (2009g) Fragrances in Germany: Industry Profile. October 2009. London: Datamonitor.
Datamonitor (2009h) Global Fragrances: Industry Profile. October 2009. London: Datamonitor.
Datamonitor (2009i) Fragrances in India: Industry Profile. October 2009. London: Datamonitor.
Datamonitor (2009j) Fragrances in Italy: Industry Profile. October 2009. London: Datamonitor.
Datamonitor (2009k) Fragrances in Japan: Industry Profile. October 2009. London: Datamonitor.
Datamonitor (2009l) Fragrances in Mexico: Industry Profile. October 2009. London: Datamonitor.
Datamonitor (2009m) Fragrances in South Africa: Industry Profile. October 2009. London: Datamonitor.
Datamonitor (2009n) Fragrances in Spain: Industry Profile. October 2009. London: Datamonitor.
Datamonitor (2009o) Fragrances in United Kingdom: Industry Profile. October 2009. London: Datamonitor.
Datamonitor (2009p) Fragrances in the United States: Industry Profile. October 2009. London: Datamonitor.
DEFRA (2009). “Sustainable operations on the government estate”. Available at: http://www.defra.gov.uk/sustainable
/government/gov/estates/#targets 2009 [Date Accessed: 8th March 2010]
Keynote (2008). Cosmetics and Fragrances. March 2008. Hampton: Keynote
8. Appendices
Appendix 1 Growth Rates For Certain Countries
| Growth Rate of Certain Countries As An Indicator For The Life Cycle Analysis | |||||||
| Year | |||||||
| 2008 | 2009 | 2010 | 2011 | 2012 | 2013 | 2008-2013 | |
| Europe | 2.04% | 2.02% | 2% | 1.98% | 1.96% | 1.96% | 1.99% |
| France | 1.70% | 1.70% | 1.70% | 1.70% | 1.70% | 1.70% | 1.70% |
| Germany | 0.30% | 0.30% | 0.30% | 0.20% | 0.20% | 0.20% | 0.25% |
| Italy | 2.20% | 2.20% | 2.10% | 2.10% | 2.00% | 2.00% | 2.10% |
| Spain | 4.00% | 4.00% | 4.00% | 4.00% | 4.00% | 4.00% | 4.00% |
| UK | 2.00% | 1.90% | 1.90% | 1.90% | 1.90% | 1.90% | 1.92% |
| Asia – Pacific | 5.33% | 5% | 5.03% | 4.88% | 4.88% | 4.58% | 4.96% |
| Australia | 5.20% | 5.00% | 4.80% | 4.80% | 4.80% | 4.60% | 4.87% |
| China | 9.80% | 9.50% | 9.30% | 9.20% | 9.10% | 8.90% | 9.30% |
| India | 8.50% | 7.40% | 7.60% | 7.10% | 7.20% | 6.40% | 7.37% |
| Japan | -2.20% | -1.50% | -1.60% | -1.60% | -1.60% | -1.60% | -1.68% |
| Americas | 4.025% | 3.425% | 3.325% | 3.175% | 3.1% | 3% | 3.34% |
| Canada | 3.00% | 2.90% | 2.80% | 2.60% | 2.60% | 2.40% | 2.72% |
| Brazil | 14.20% | 11.80% | 11.40% | 10.90% | 10.60% | 10.40% | 11.55% |
| Mexico | 2.10% | 1.90% | 1.80% | 1.70% | 1.60% | 1.50% | 1.77% |
| US | -3.20% | -2.90% | -2.70% | -2.50% | -2.40% | -2.30% | -2.67% |
| Africa | 5.60% | 5.40% | 5.20% | 4.90% | 4.70% | 4.50% | 5.05% |
| South Africa | 5.60% | 5.40% | 5.20% | 4.90% | 4.70% | 4.50% | 5.05% |
Source: Datamonitor (2009, 2009a, 2009b, 2009c, 2009d, 2009e, 2009f, 2009g, 2009h, 2009i, 2009j, 2009k, 2009l, 2009m, 2009n, 2009o, 2009p)
Appendix 2 Market Value For Certain Countries
| Market Value of Certain Countries As An Indicator For The Life Cycle Analysis, $ Billion | |||||||
| Year | |||||||
| 2008 | 2009 | 2010 | 2011 | 2012 | 2013 | 2008-2013 | |
| Europe | 2.33 | 2.392 | 2.436 | 2.5 | 2.546 | 2.608 | 0.28 |
| France | 2.84 | 2.88 | 2.93 | 2.98 | 3.04 | 3.09 | 0.25 |
| Germany | 2.43 | 2.43 | 2.44 | 2.45 | 2.45 | 2.45 | 0.02 |
| Italy | 1.37 | 1.40 | 1.43 | 1.46 | 1.49 | 1.52 | 0.15 |
| Spain | 3.30 | 3.50 | 3.60 | 3.80 | 3.9 | 4.1 | 0.80 |
| UK | 1.71 | 1.75 | 1.78 | 1.81 | 1.85 | 1.88 | 0.17 |
| Asia – Pacific | 0.45 | 0.46 | 0.47 | 0.49 | 0.51 | 0.53 | 0.08 |
| Australia | 0.43 | 0.45 | 0.47 | 0.49 | 0.52 | 0.54 | 0.11 |
| China | 0.51 | 0.58 | 0.61 | 0.67 | 0.73 | 0.79 | 0.28 |
| India | 0.03 | 0.03 | 0.03 | 0.03 | 0.04 | 0.04 | 0.01 |
| Japan | 0.81 | 0.79 | 0.77 | 0.76 | 0.75 | 0.73 | -0.08 |
| Americas | 2.74 | 2.83 | 2.93 | 3.02 | 3.15 | 3.31 | 0.57 |
| Canada | 0.70 | 0.72 | 0.74 | 0.75 | 0.77 | 0.79 | 0.09 |
| Brazil | 4.10 | 4.60 | 5.10 | 5.60 | 6.20 | 6.90 | 2.80 |
| Mexico | 0.63 | 0.64 | 0.65 | 0.66 | 0.67 | 0.68 | 0.05 |
| US | 5.53 | 5.36 | 5.23 | 5.08 | 4.96 | 4.85 | -0.68 |
| Africa | 0.41 | 0.43 | 0.46 | 0.48 | 0.50 | 0.53 | 0.12 |
| South Africa | 0.41 | 0.43 | 0.46 | 0.48 | 0.50 | 0.53 | 0.12 |
Source: Datamonitor (2009, 2009a, 2009b, 2009c, 2009d, 2009e, 2009f, 2009g, 2009h, 2009i, 2009j, 2009k, 2009l, 2009m, 2009n, 2009o, 2009p)